RSS

Canada’s housing market kept up its momentum in July 2025, marking the fourth straight month of transaction gains, according to the latest report from the Canadian Real Estate Association (CREA). While overall sales activity remains lower than historical

Sales climb for fourth consecutive month

Home sales recorded through Canadian MLS® Systems rose 3.8% month over month in July. Since March, national transactions have increased a total of 11.2%, with the Greater Toronto Area leading the charge. The GTA’s rebound has been especially striking, with sales surging 35.5% since March, even though activity is still below typical levels.

“With sales posting a fourth consecutive increase in July, and almost 4% at that, the long-anticipated post-inflation crisis pickup in housing seems to have finally arrived,” said Shaun Cathcart, CREA’s senior economist, in the report. “Looking ahead a little bit, it will be interesting to see how buyers react to the burst of new supply that typically shows up in the first half of September.”

Price trends remain stable

The national average sale price edged up 0.6% compared to July 2024, while the National Composite MLS® Home Price Index (HPI) was unchanged from June to July. Year over year, the HPI fell 3.4%, a smaller decline than in June, suggesting price drops are moderating.

New listings and market balance

New supply in July was virtually unchanged from June (+0.1%). With sales picking up, the national sales-to-new listings ratio rose to 52%, up from 50.1% in June and 47.4% in May. This reading remains within the 45–65% range typically associated with balanced market conditions.

At the end of July, 202,500 properties were listed for sale across the country, 10.1% higher than a year ago and right in line with the long-term average for this time of year. Nationally, there were 4.4 months of inventory available, still below the long-term average of five months. This tightening suggests conditions could lean toward sellers if the trend continues.

“Activity continues to pick up through the transition from the spring to the summer market, which is the opposite of a normal year, but this has not been a normal year,” said Valérie Paquin, CREA Chair. “Typically, we see a burst of new listings right at the beginning of September to kick off the fall market, but it seems like buyers are increasingly returning to the market.”

Read

South Okanagan Real Estate Statistics January 2025

January 2025 is in the books and with that said, here’s how things are shaping up for South Okanagan Real Estate for the new year. 

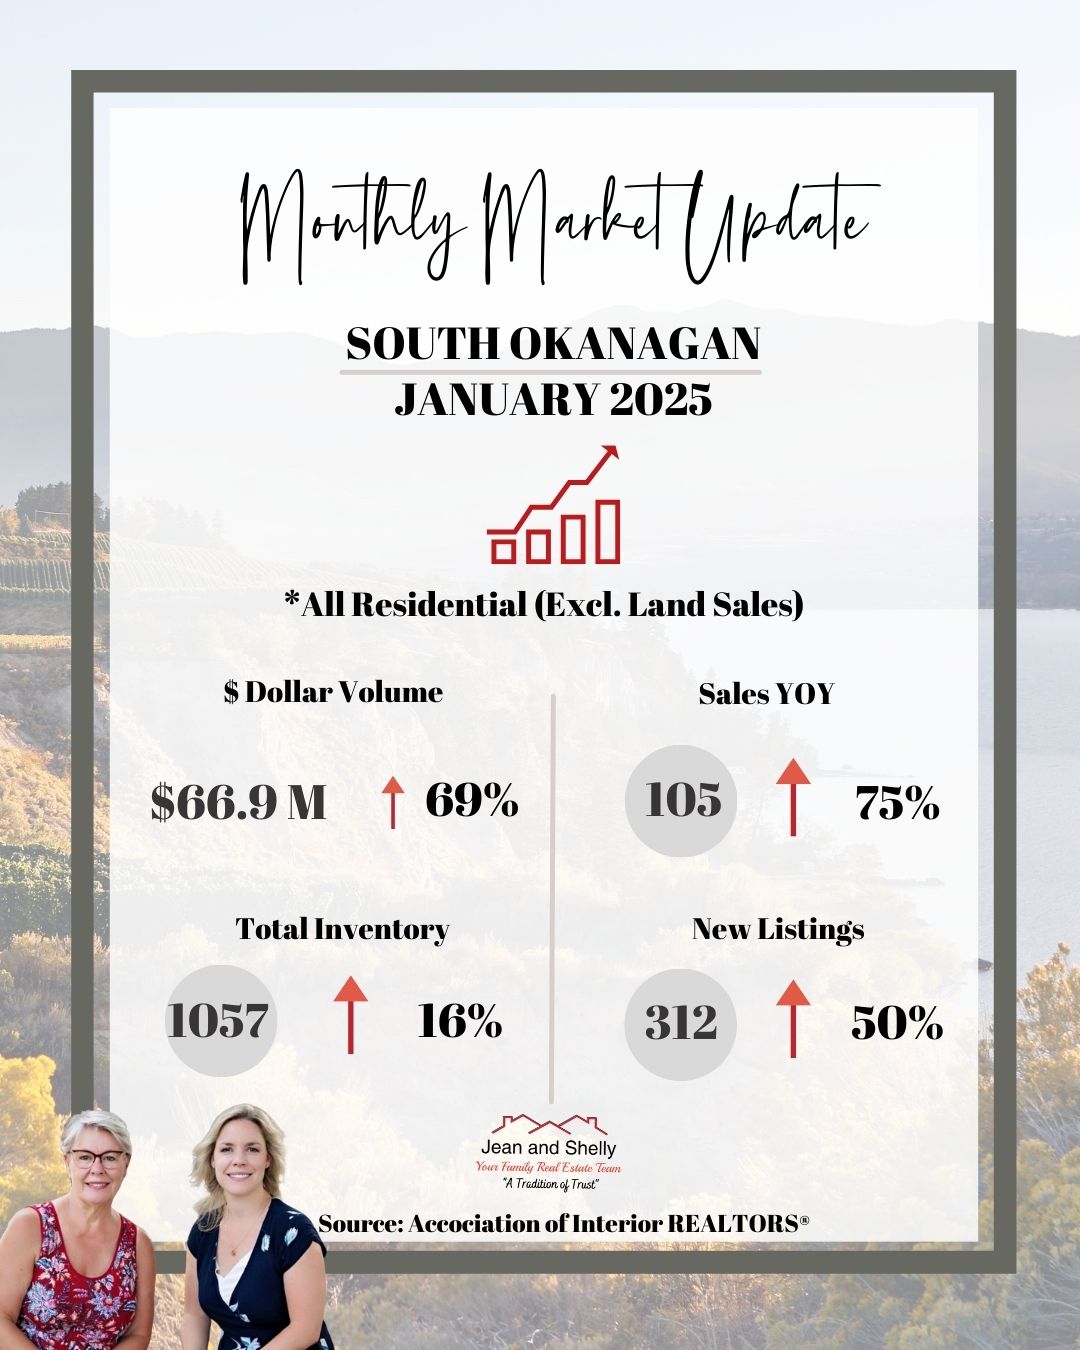
Residential Sales for all property types in the South Okangan (excluding land sales) this saw quite an uptick in activity which is great to see and undoubtedly due to yet another interest rate drop and price adjustments since August of 2023. The South Okanagan Region saw $66.9 Million dollars in sales volume, a 69% increase by logging 105 sales an increase of 75% year over year.  Inventory is still higher than what we are used to seeing at over 10 months of inventory and 1057 active listings, which is yes antoher increase to record year over year of 16%.

The breakdown for Single Family Homes specifically in the South Okanagan saw increases in all 4 categories, sales where up 65% at 43, Benchmark values were up by 11% to $769,200, Inventory levels for single family homes grew 11% and the recorded days on market increased by 5% and 103 days on market as shown abouve.

In the townhouse relm, sales increased 78%, benchmark prices as well by 8%, and inventory came up year over year by 19%, while we saw decreases in days on market by 20%.

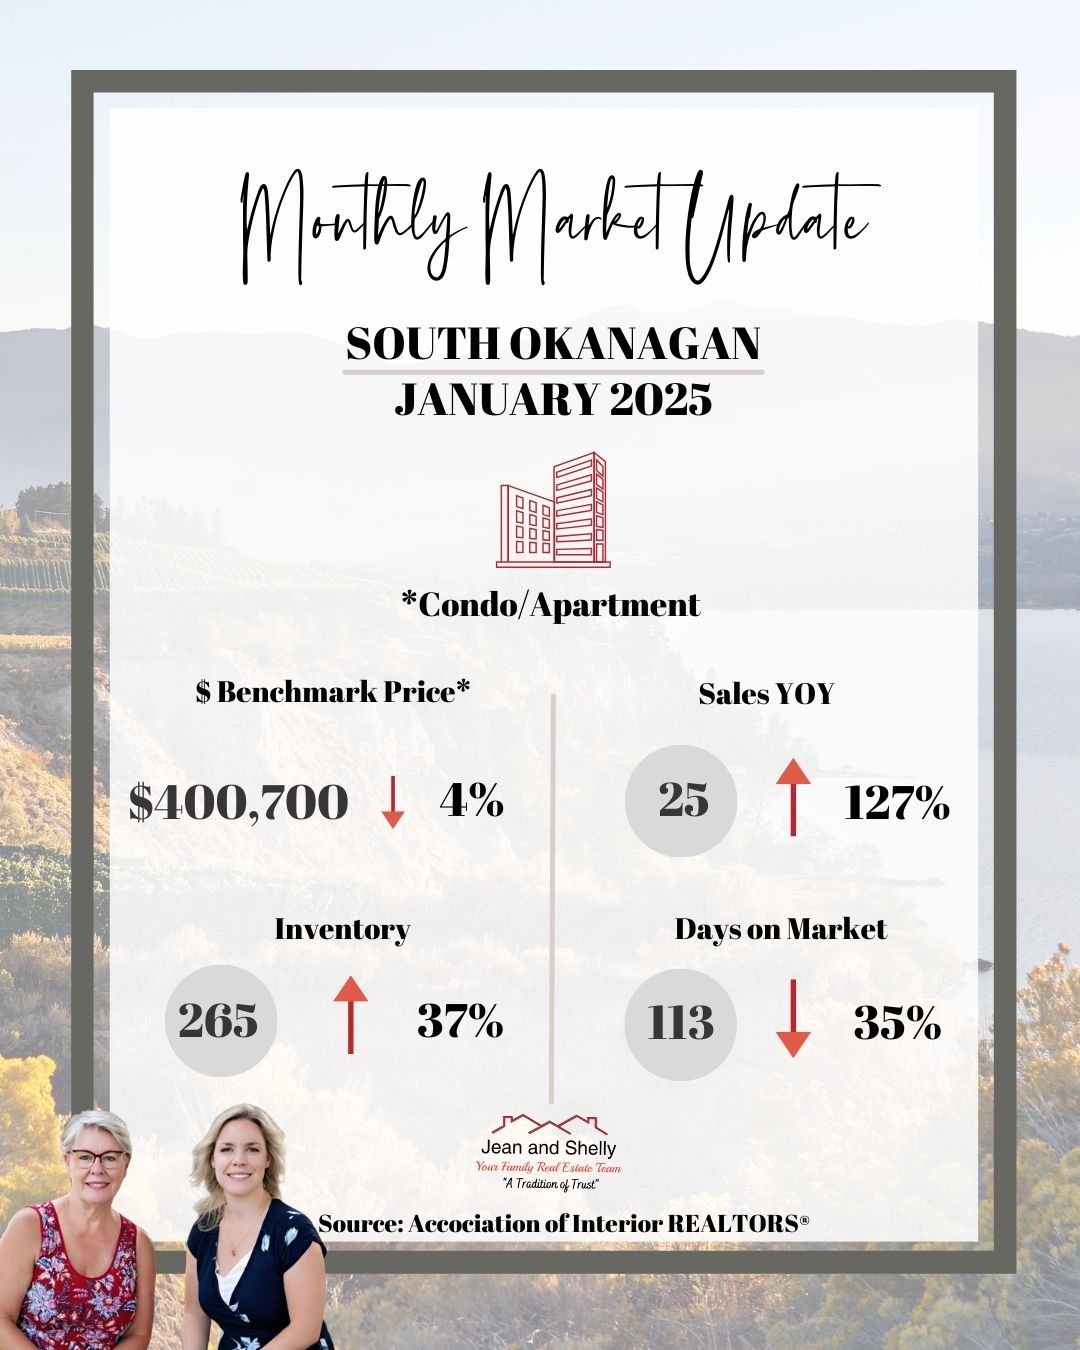
For the Condo/Apartment category, we saw increases in Sales 127%, and Inventory 37%, with a downward turn on Benchmark pricing by 4% at $400,700 and most definately due to the amount of active listings in this specific category recorded at 265, however the days on market also came down by 36% which is a hopefull figure if you are a seller in this category, but still patienly recording an average of 113 days on market.

We will continue to watch closely and keep you all well informed on the ever changing market conditions and post them right here. Please dont hesitate to reach out if you have any questions about your buying/selling journey or need to know more about your properties value in todays market! 

Have a great February! 

Jean and Shelly

Read
The trademarks REALTOR®, REALTORS®, and the REALTOR® logo are controlled by The Canadian Real Estate Association (CREA) and identify real estate professionals who are member’s of CREA. The trademarks MLS®, Multiple Listing Service® and the associated logos are owned by CREA and identify the quality of services provided by real estate professionals who are members of CREA. Used under license.